In your custom-made Word, by using the block tag between the table rows, you can change the display according to your data collected on the ground.
Goal:
You are a landscaping company and you need to know quickly where you have to send your teams in intervention. At first, your employee visits different residences to check the conformance of the green areas by taking photos to confirm his passage. In case of non-conformance or problem encountered, he specifies more information and also takes several photos to prove the non-conformance. The Green Space Conformance Report must display the following information:
- The state of conformance with a colour code.
- Photos of non-conformance residences to quickly assess the emergency of the intervention in this residence as well as the personnel / equipment required.
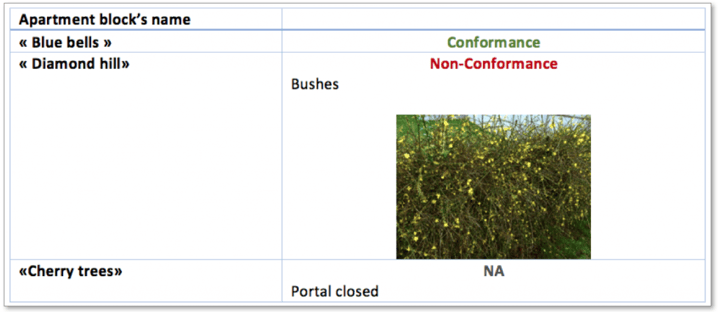
In our example below, the employee has just inspected three apartment blocks. One of them, « Diamond hill » is non-conformance. It is therefore imperative to highlight this non-conformance by a colour code and a photo. 
Configuration:
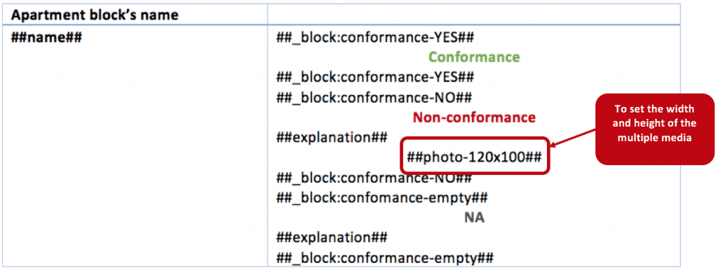
In your custom-made Word, you have to add a table and for each residence, provide three possible answers: Conformance, Non-Conformance and Not Available, with three desired formatting.
Each formatting must be surrounded by the block tags to get the following result:
- Conformance: a green message will be displayed,
- Non- conformance: a red message and photos will be displayed,
- Not available: a commentary will be displayed.

For further...
- How do I show or hide a part of your custom-made document?
- Discover all tags available to personalise your reports and emails!
- How to make a customised Word?
- Manage the visibility of your items as you type on your form.
- How to delete titles and several items according to your entry in your custom-made report?
